When launching a new ad business, publishers often feel overwhelmed deciding which reporting features to offer. Publishers wonder: what are the must-have metrics? Would offering more reporting metrics distinguish their platform? Are there other important considerations when deciding how / what to report?
Having robust reporting capabilities means more than just offering metrics for the sake of metrics. Instead, the best reporting provides value to advertisers by telling a compelling story about human behavior using data. Optimal reporting provides insights an advertiser can use to interpret not just their ad’s performance, but their business performance as a whole.
In this article, we discuss the table stakes reporting metrics, as well as what metrics would make your reporting stand out.
Jump to
- Standard expected metrics
- Retail media and marketplace reporting metrics
- Unique reporting metrics
- Different segmentation opportunities
- Generating advertiser recommendations
- Reporting examples
Standard expected metrics
Though reporting features vary by platform and industry, there are standard metrics most publishers report, like:

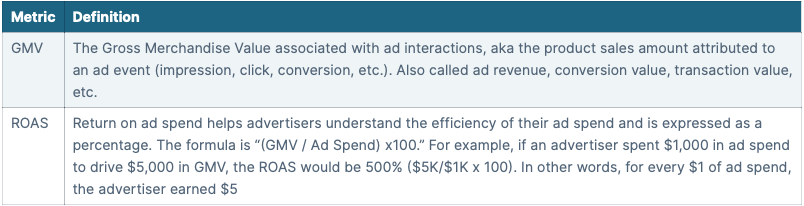
Retail media and marketplace reporting offerings
Beyond the previous metrics, your industry impacts which metrics are important to prioritize. For retail media and marketplaces, for example, advertisers expect to see the below data (you can thank Amazon for setting precedent).
Other unique reporting offerings
There are dozens of alternative reporting metrics you could offer. Depending on your available ad units, you could include:

New ad platforms can survive without these metrics, but sophisticated advertisers will want to see them eventually. Data like video view completions and unique reach tell a more robust story than just raw impressions and clicks.
Different segmentation opportunities
Getting the most out of your metrics doesn’t just end at impressions, clicks, and conversions. Segmenting this information can give you more granular insights into user behavior. For instance, publishers could segment and report based on:
- Campaign hierarchy:
- Advertiser as a whole
- By campaign
- By ad group
- By creative
- First-party data
- Gender
- Age
- Income
- Behavioral segments
- Contextual placements
- Categories (think: a retailer highlighting what subcategories led to the most interactions)
- Specific channels / accounts (think: YouTube showing what specific channels drove the most clicks, or Reddit reporting by subreddit)
- Specific sites / apps (if you're an ad network and work with many publishers, you could show a publisher-level breakdown)
- Intent
- Highlight what specific searches drove the most results, without the advertiser needing to set up separate ads for each keyword
- Platform
- Device type
- Device manufacturer
- OS
- Time / day
- Location (country at the very least)
Breaking out performance into audience segments not only gives you a better understanding of who is interacting with your ads, but also provides additional business context. If, for example, Allbirds realizes women infrequently interact with their ads, this could be due to the ad itself, but it could also be an indicator for opportunity to grow the brand and product with new colors and styles that appeal to a segment that may not originally been part of their core audience.
Generate advertiser recommendations
Again, reporting isn’t just about showing data, it’s about providing insights that tell a story. One way to do this is by offering recommendations based on advertiser reporting metrics.
This means proactively analyzing data and presenting this to users in real-time. Google, for example, offers insightful recommendations when you log into their portal, such as:
- How to improve CTR
- Methods for increasing conversions
- Performance-based budgeting: If an ad performs well, Google invites you to spend more on it, whereas if an ad performs poorly, it points to redirecting your budget elsewhere
- Keyword analysis: Recommendations based on top-performing keywords
Here, Google provides value behind the numbers. They don’t just tell advertisers how they are doing, but how to do even better.

Reporting examples
As mentioned, it’s important to use your reporting to tell a story and offer business insights beyond just interactions and results. Below are some examples of how leading ad platforms have done that:
1. Google: Google offers a variety of insightful data beyond basic reporting. When doing paid search campaigns, for instance, advertisers set up campaigns targeting their ideal keywords. After launching, you can then see exactly what search terms led to clicks, even if you didn’t specifically target that exact phrase.
Such insights help advertisers understand what phrases potential customers are using and which ones resonate. This is business information that could impact website messaging, ad copy, and so on.

2. Facebook: Facebook provides multiple ways of slicing and dicing campaign performance, key ones being basic demographics like gender and age. These insights could be helpful in tailoring messaging, setting up new campaigns targeting specific age/genders, identifying one’s target audience, and more.

3. LinkedIn: LinkedIn lets advertisers break down any campaign by demographic work data. For instance, after running a campaign targeting a certain industry, you can see attributes about who exactly interacted with the ads.
The breakdowns include by department, seniority, title, company size, and more. This is information that could influence your messaging and what types of companies you outbound to.

Conclusion
Publishers don’t need to reinvent the wheel with their reporting offering. Advertisers have standard expectations, and fulfilling these in an easy-to-read dashboard goes a long way. By focusing on strategies for effective ad publishing, publishers can ensure they meet advertiser expectations while providing valuable insights. Implementing these strategies can streamline communication and enhance the overall advertising experience. This not only strengthens relationships with advertisers but also boosts overall engagement and satisfaction.
However, clever publishers offer additional insights that go beyond standard metrics to really distinguish their platform. If publishers can help their advertisers understand how users interact with their brand and offer data-based recommendations, advertisers will value the publisher and continue to spend.
About Kevel
Kevel offers the infrastructure APIs needed to quickly build custom ad platforms for sponsored listings, internal promotions, native ads, and more - so you can drive new revenue and take back the Internet.
We are committed to the vision that every online retailer and publisher should be able to add user-first ad revenue streams and take back the Internet from Google, Amazon, and Facebook. Customers like Ticketmaster, Yelp, Strava, Mozilla, and many more have already launched successful ad platforms on Kevel.